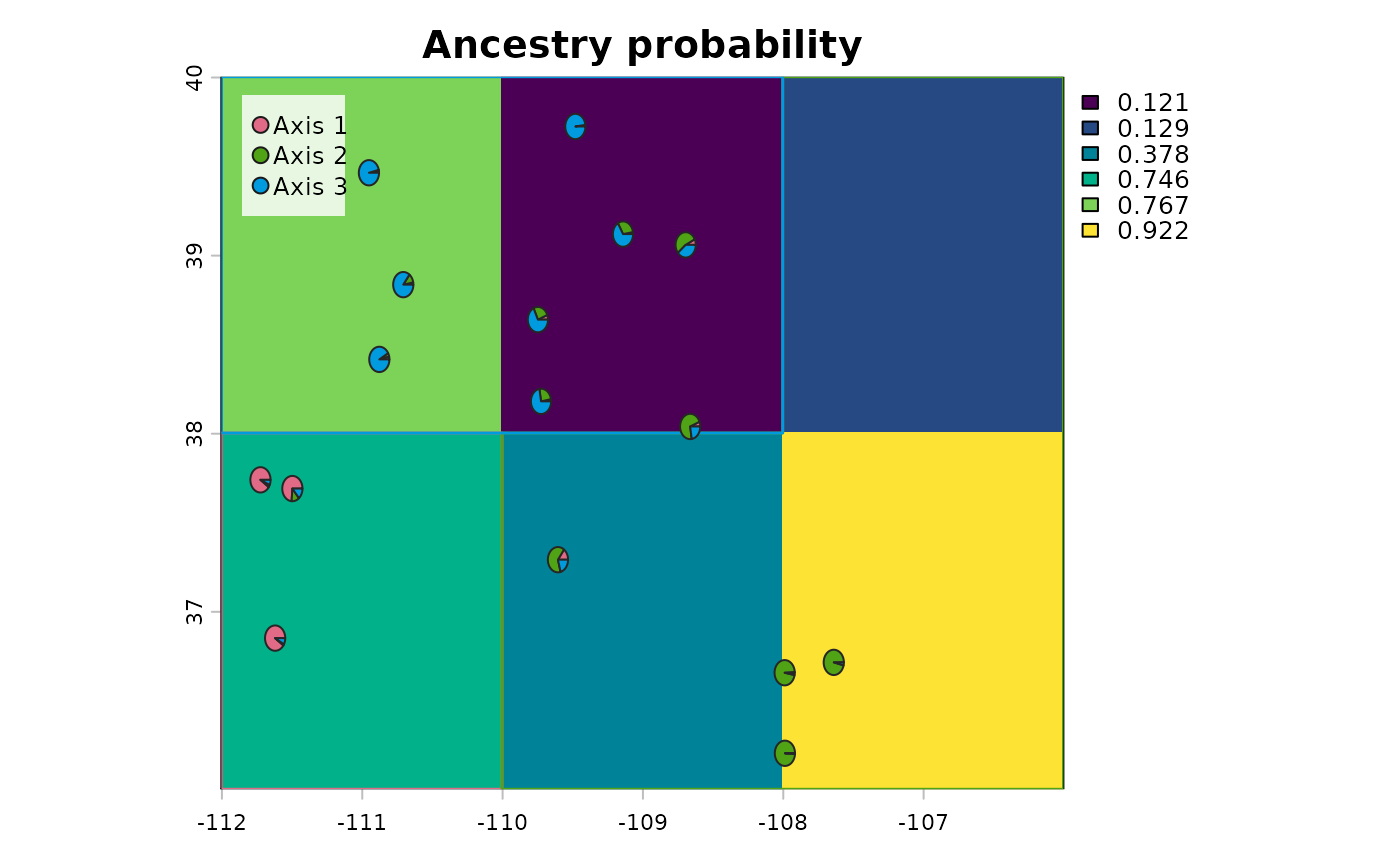
plot_popmaps() draws cleaner, terra-based maps from the list returned by
popmaps(). It is intended as the modern plotting layer for popmaps2, while
popmap_viz() remains available for POPMAPS 1.03 compatibility.
Usage
plot_popmaps(
  pop_raster_list,
  input_raster,
  input_locs = NULL,
  type = c("confidence", "boundary", "axis", "ancestry"),
  style = c("modern", "manuscript"),
  axis = 1,
  sites = c("pies", "points", "none"),
  site_legend = TRUE,
  boundaries = TRUE,
  palette = "Viridis",
  boundary_palette = "Dark 3",
  background_raster = NULL,
  background_threshold = NULL,
  background_palette = "manuscript_background",
  state_lines = FALSE,
  state_col = "grey15",
  state_lwd = 0.8,
  n = 100,
  legend = TRUE,
  axes = TRUE,
  frame.plot = FALSE,
  main = NULL,
  col_na = "transparent",
  boundary_alpha = 0.2,
  boundary_lwd = 1.4,
  pie_radius = NULL,
  point_cex = 1,
  add = FALSE,
  ...
)
Arguments
- pop_raster_list
A list returned by
popmaps().- input_raster
The raster used to create
pop_raster_list. It may be aterra::SpatRaster, a legacyraster::RasterLayer, or a raster file path.- input_locs
Optional POPMAPS location table. When supplied, empirical sampling locations are drawn as ancestry pies or dominant-ancestry points.
- type
Map type to draw.
"confidence"plots the dominant ancestry confidence layer,"boundary"plots hard population assignments, and"axis"plots one weighted ancestry-axis layer."ancestry"is accepted as a legacy alias for"confidence".- style
Plot style.
"modern"uses the default popmaps2 map style."manuscript"uses a Massatti and Winkler (2022)-inspired style with grayscale confidence, colored hard-boundary outlines, muted suitability background, and state outlines when available.- axis
Ancestry axis used when
type = "axis". Supply either an integer axis number or a layer name such as"axis_1".- sites
How to draw empirical locations when
input_locsis supplied."pies"draws ancestry-proportion pies,"points"draws points colored by dominant ancestry, and"none"suppresses site symbols.- site_legend
Logical. If
TRUE, draw an ancestry-axis legend for site symbols.- boundaries
Logical. If
TRUE, hard-boundary outlines are overlaid on ancestry and axis maps.- palette
Continuous color palette for ancestry and axis maps. Named palettes are matched to base R HCL palettes; common choices include
"Viridis","Mako","Inferno","YlGnBu", and"Purple-Yellow". A custom color vector may also be supplied.- boundary_palette
Categorical color palette for ancestry axes and hard boundaries. Named palettes are matched to base R HCL palettes, or a custom color vector may be supplied.
- background_raster
Optional suitability, habitat, or prediction raster drawn beneath the POPMAPS confidence layer. In
style = "manuscript", this defaults toinput_raster.- background_threshold
Optional numeric cutoff. When supplied, ancestry confidence or axis values are shown only where
background_rasteris greater than or equal to the cutoff; lower cells show only the background.- background_palette
Color palette for
background_raster.- state_lines
Logical. If
TRUE, overlay state boundaries from themapspackage. This is intended for US longitude/latitude outputs.- state_col
Color for state boundaries.
- state_lwd
Line width for state boundaries.
- n
Number of colors used for continuous raster maps.
- legend
Logical. If
TRUE, draw raster and site legends.- axes
Logical. If
TRUE, draw map axes.- frame.plot
Logical. If
TRUE, draw a frame around the map panel.- main
Optional plot title. If
NULL, a title is chosen fromtype.- col_na
Color used for
NAraster cells.- boundary_alpha
Fill transparency for hard-boundary maps.
- boundary_lwd
Line width for hard-boundary outlines.
- pie_radius
Radius for empirical-site pies in map units. When
NULL, a conservative radius is chosen from the map extent.- point_cex
Point size for
sites = "points".- add
Logical. If
TRUE, add the raster layer to the existing plot.- ...
Additional arguments passed to
terra::plot().
Value
Invisibly returns the terra::SpatRaster created by popmaps_rast().